| 
                  
                    |  |  
                    | 


                    | 
                      
                        |  | 
                          
                            
                              | 
                                
                                  |  |  
                                  |  | Learn thru webinars |  |  
                                  |  | 
                                    The whole world can learn for free. 
 Learn, access our presentations, access our elearning content and take online exams.
 |  |  |  |  |  |  
                    |  |  |  
                    |  |  
                    |  |  
                    |  |  |  | 
                  
                    |  |  
                    |  |  
                    | 
					  
                        
                          | 
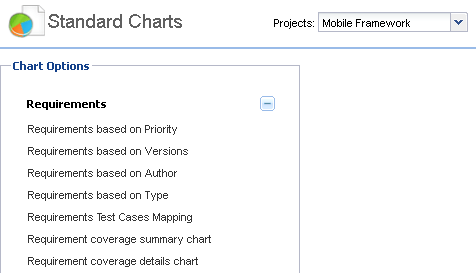
                          QAMonitor provides amazing charts to visulaize metrics. 
								 |  
                          |   |  
                          | 
                          1. Login as any user.2. Go to Charts page.
 3. Select a project from the list box.
 4. Expand the requirements charts section on the left hand side.
 5. A set of charts that are configured for you will appear as a list.
 6. Click on a chart and it will open the chart on the right hand side panel.
 
 |  
                          |   |  
                  |  |  
                        |   |  
                    |  |  |  
                    |  |  
                    |  |  |  |  |